Kai Tan Laboratory - Software
CSI-ANN
Discover functional DNA elements based on their epigenetic profiles
CSI-ANN allows the user to predict regulatory DNA elements using chromatin modification data. The user provides chromatin modification data (e.g., H3K4me1, H3K4me3, H3K27ac, etc.), either ChIP-chip or ChIP-Seq, and the software produces a text file containing the prediction centers of regulatory DNA elements (genomic positions) across the regions/genomes.
The CSI-ANN framework consists of a data transformation and a feature extraction step followed by a classification step using Time-Delay Neural Network (TDNN). Chromatin modification data can be used directly by the software (i.e. using summary statistic in a window) or processed through a pre-processing step to generate additional features (e.g., statistical measures such as variance, kustosis). Input Data are provided to the software in a prespecified format (see T cell sample files provided). The software is written in C.

The above figure presents a flow chart of the CSI-ANN framework. It contains three components: A) data transformation of preprocessed histone modification data; B) feature reduction by Fisher Discriminant Analysis; C) classification by TDNN with False Discovery Rate (FDR) calculation.
The CSI-ANN method is described in the following paper: Firpi HA, Ucar D, and Tan K. Discover regulatory DNA elements using chromatin signature and artificial neural network. 2010. Bioinformatics. 26(13):1579-1586.
miPALM
Infer gene modules from molecular interaction networks
miPALM is a novel algorithm for detecting protein complexes from large protein protein interaction networks with improved accuracy than previous methods. The algorithm uses a novel graph theoretic measure, parametric local modularity, to identify highly connected sub-networks as candidate protein complexes. The software is implemented in Matlab and is freely available for academic use.
Download miPALM Windows version
Please cite: Jongkwang Kim and Kai Tan. Discover Protein Complexes in Protein-Protein Interaction Networks Using Parametric Local Modularity BMC Bioinformatics 2010. 11:521.
Usage
miPALM -a 0.364 -d 2.4 [-i input.net] [-o output.txt]
where -a and -d are standard parameters of miPALM and other command line parameters are optional:
-i (default standard dialog box) is a Pajek file containing unique node IDs and interactions among them.
-o (default standard file output) is the file to contain the detected complexes by miPALM. Default output file will be named as "input_a0.364_d2.4.txt" in "results" sub-folder.
Example
Given the input file called "my_input.net":
*Vertices 4
1 "P46677"
2 "P21372"
3 "P20433"
4 "Q00916"
*Edges
1 2
1 3
2 3
2 4
3 4
Please note that the example above has no edge-weight on the 3rd column and no vertex-position.
miPALM might be run as
miPALM -a 0.374 -d 2.33
To specify a user input file name (using the default output-file name)
miPALM -a 0.374 -d 2.33 -i my_input.net
To specify a user!/s output file name (using the default dialog box for input-file)
miPALM -a 0.374 -d 2.33 -o my_output.net
To input "Yeast_PPI_DIP_FULL.net" in the sub-folder "data" and to generate output file "my_output.txt" in the sub-folder "results"
miPALM -a 0.374 -d 2.33 -i data\Yeast_PPI_DIP_FULL.net -o results\my_output.txt
The generated "my_output.txt" looks like this:
Rank Score Proteins Complex
--------------------------------------------------------------
1 5.75 9 P09119 P54784 P32833 P54791 P54790 P38826 P50874 P32579 P38185
2 5.33 10 P41543 P39007 P33767 P48439 Q99380 Q92316 P46964 P53062 P47818 Q04629
3 5.25 9 P45976 Q06102 P29468 Q12102 Q01329 P38912 P39927 P53538 Q03713
4 5.09 12 P32074 P22804 P11076 P20606 P22214 P25385 P22213 P41834 P40509 P05738 P43621 P28791
5 5.00 9 P34253 Q04868 Q06706 P38874 Q02908 P42935 Q02884 Q06177 P46974
6 5.00 5 P36116 P39904 Q99260 P47061 Q12071
7 5.00 7 P40480 P36124 P14832 P25357 P53685 P53096 P22943
8 4.89 10 Q07468 P53129 P37898 P12868 Q03308 P27801 P39702 P38959 P20795 P38273
9 4.83 13 P09547 P32479 P32480 P22082 P18480 P43554 P32591 P38064 Q06090 P53628 Q05123 Q12406 Q06349
10 4.75 9 P32349 P22276 P35718 P32910 P04051 P20436 Q04307 P17890 P47076
In addition to *.txt file above, miPALM also generates another text file to contain protein node-numbers of a complex in each line. For more details, see "README.txt" file in the uncompressed folder.
For your subsequent analysis and visualization, miPALM automatically exports *.txt file to *.sif and *.net file for each predicted complex which can be imported into Cytoscape and Pajek, respectively.
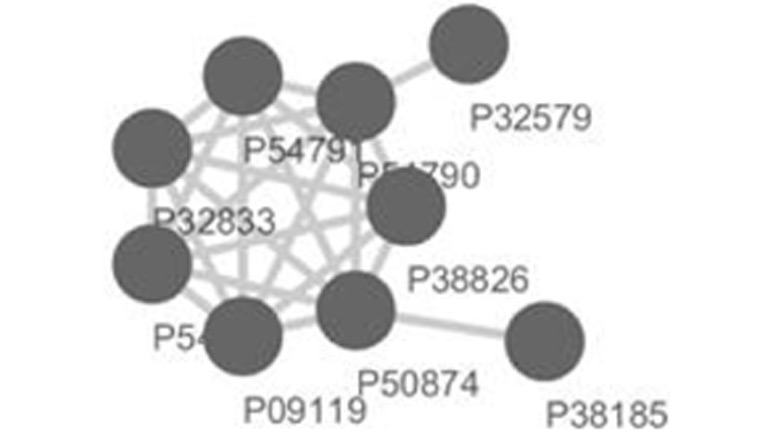
Figure 1. The top-scored sub-network in Yeast DIP-PPI network detected by miPALM and visualized by Cytosca
CoSBI
Identify combinatorial chromatin modification patterns across genomic loci
Chromatin modifications, such as post-translational modification of histone proteins and incorporation of histone variants, play an important role in regulating gene expression. Individual histone modifications can regulate gene expression by changing chromatin structure and creating binding sites for effector proteins. More importantly, joint analyses of multiple histone modification maps are starting to reveal combinatorial patterns of histone modifications that are associated with functional DNA elements, providing strong support to the unified ‘histone code’ hypothesis. Due to the lack of computational methods, only a small number of chromatin modification patterns have been associated with well-known functional DNA elements, e.g. promoters and enhancers. To develop novel insights into the histone code, we propose a scalable subspace clustering algorithm, Coherent and Shifted Bicluster Identification (CoSBI), to identify the complete set of combinatorial chromatin modification patterns across the entire genome. Comparison of CoSBI with an existing methods demonstrates that our algorithm can generate biclusters with higher intra-cluster correlation and biological relevance.
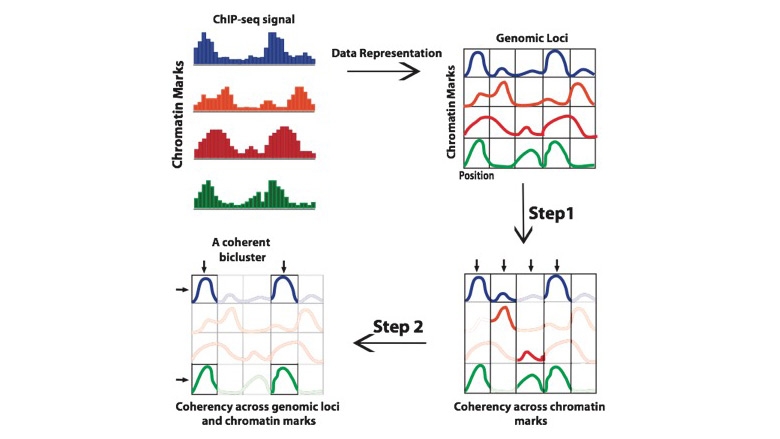
As shown in the above figure we first converts many ChIP-seq/ChIP datasets into a 3D matrix. In the first step of CoSBI, for every genomic locus, it identifies maximal subsets of chromatin modifications that exhibit coherent signals among them. In the second step, the algorithm identifies coherent patterns across both Genomic locus and Chromatin mark dimensions, generating coherent biclusters. The final output of our algorithm is a complete collection of biclusters across the genome, each of which contains a set of chromatin modifications that exhibit coherent signals across all genomic loci in the given bicluster.
You can download the CoSBI package using the link below. This package includes a command-line version of CoSBI (implemented in C++), a user friendly version of CoSBI (implemented in C++ using the Qt package) with a GUI, explanation of the CoSBI algorithm, and example datasets.
We applied our algorithm to a compendium of 39 genome-wide chromatin modification maps in human CD4+ T cells. We identified 843 combinatorial patterns that are repeated across at least 0.1% of the genome. You can download these biclusters along with their functional enrichment values as a supplemental table from our NAR paper website. A total of 19 chromatin modifications are observed in the combinatorial patterns, 10 of which occur in more than half of the patterns. Our analysis further reveals combinatorial chromatin modification signatures for 8 classes of functional DNA elements. Application of CoSBI to epigenome maps of different cells and developmental stages will aid in understanding how chromatin structure helps regulate gene expression.
The CoSBI method was originally introduced and applied to T cell in the following paper: Ucar D, Hu Q, and Tan K. 2011. Combinatorial chromatin modification patterns in the human genome revealed by subspace clustering. Nucleic Acids Res.
MAPIT
Identify deregulated molecular pathways by integrating expression, DNA methylation, and protein-protein interaction data
SS-CoSBI
Identify combinatorial chromatin modification patterns by semi-supervised biclustering
FCOP
Identify context-specific combinatorial interactions among transcription factors using ChIP-Seq data
Combinatorial interactions among transcription factors (TFs) are critical for integrating diverse intrinsic and extrinsic signals, fine-tuning regulatory output, and increasing the robustness and plasticity of the regulatory mechanism. Current knowledge about combinatorial regulation is rather limited, due to the lack of suitable experimental technologies and bioinformatic analysis tools. The rapid accumulation of ChIP-Seq data has provided genome-wide occupancy maps for a large number of TFs as well as chromatin modification marks for identifying enhancers without knowing individual TF binding sites beforehand. Integration of the two data types has not been researched extensively, resulting in under-utilized data and missed opportunities. We develop a novel method for discovering frequent combinatorial occupancy patterns by multiple TFs at enhancers. Our method is very useful for studying combinatorial gene regulation taking advantage of increasingly abundant ChIP-Seq data.
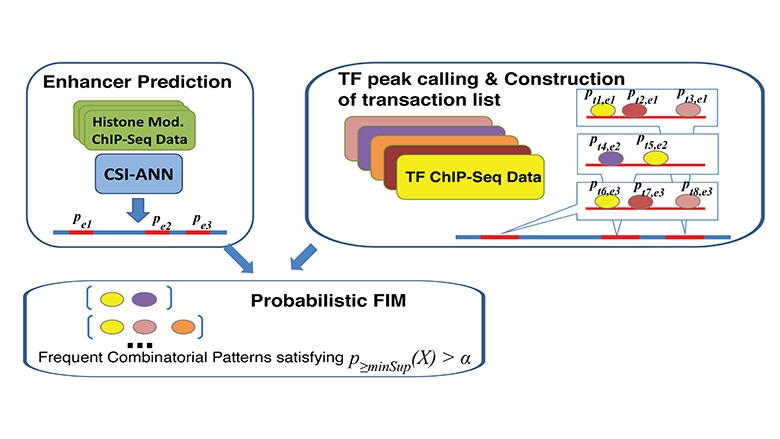
Description of the Algorithm: Our method is motivated by the concept of frequent item set mining (FIM). However, unlike traditional FIM, our method considers the probabilities of both transactions and items, which is a way to deal with uncertainty in ChIP-Seq data. Our method has the following three components: 1) calculation of probabilities associated with enhancers (transactions) and TF binding peaks (items); 2) automatic determination of pattern-specific minimum support threshold; 3) calculation of frequentness probability of candidate FCOPs using an uncertain transaction database and dynamic programming.
Input Data: The input data consists of genome-wide location information for enhancers and multiple TFs and probability values that are associated with each type of sequence. Enhancers can be defined based on co-factor (e.g. P300) ChIP-Seq or based on chromatin modification signature. In our study, we define genome-wide enhancers using CSI-ANN and histone modification ChIP-Seq data. For each predicted enhancer CSI-ANN assigns a probability. The higher the probability the more confidence we have in the prediction. The other required data type is TF Chip-Seq data. Binding peaks for TF can be called using a number of peak callers such as MACS.
The software package can be downloaded using the link below. This package includes a command-line version of the software (implemented in C++), readme file explaining how to run the software, and example datasets.
The method was originally described in the following paper: L. Teng, B. He, P. Gao, L. Gao and K. Tan 2014. Discovering context-specific combinatorial transcriptional factor interactions by integrating diverse ChIP-Seq datasets. Nucleic Acids Res. 42(4):e24, 2014
IM-PET: Integrated Methods for Predicting Enhancer Targets
Identify target promoters of distal transcriptional enhancers by integrating multiple types of genomics data
In eukaryotes, gene expression is controlled by short regulatory DNA sequences called enhancers. How does an enhancer select its target promoter(s) is a major challenge in the field of gene regulation. Advances in genomic technologies have enabled rapid and comprehensive identification of active promoters and enhancers for many cell types. But there is a lack of methods to link bona fide enhancers and their target promoters. Here, we develop and integrate multiple genomic features into a statistical predictor for enhancer-promoter interactions. Our approach presents a systematic and effective strategy to decipher the mechanisms underlying enhancer and promoter communication.

Description of the Algorithm: We devised and tested four features for their abilities to discriminate a set of ~2000 real and non-interacting EP pairs that are selected based on published ChIA-PET data. The four features are 1) distance constraint (DIS); 2) enhancer and target promoter activity profile correlation (EPC); 3) TF and target promoter correlation (TPC); and 4) co-evolution of enhancer and target promoter (COEV). All these genomic features can be extracted from public database. For genome-wide prediction of EP pairs, we first use CSI-ANN and histone modification ChIP-Seq data (specific to each cell type) to predict enhancers. For each predicted enhancer we extract all candidate promoters within a distance range (e.g. 2M bp) and compute the four feature scores separately for all EP pairs. We next use random forest classifier to integrate the four features for linking enhancers to their target promoters.
Input Data: There are three required input files for genome-wide prediction of EP pairs by IM-PET: 1) enhancer positions; 2) genome-wide enhancer signals; and 3) gene expression information. The first 2 files are the output directly from CSI-ANN, which uses histone modification ChIP-Seq data to predict enhancers. We recommend using the combination of H3K4me1, H3K4me3, and H3K27ac as it mark active enhancers. Users can also use fewer number of histone marks (e.g. combination of H3K4me1 and H3K4me3) or even DHS sites. For gene expression information, we recommend RNA-Seq data as this type of data can distinguish different transcripts better than microarray data. However, microarray data is also applicable. We recommend the user to process the RNA-Seq data using Tophat and Cufflinks software. IM-PET uses as input one of the output files of Cufflinks "isoforms.fpkm_tracking".
M-Module
Simultaneous analysis of multiple functional gene networks to identify shared and network-specific modules
4DGenome
A general repository for chromatin interaction data